The Best Stock Scanner for Swing Traders 2026: Pattern Detection vs. Traditional Screening
Most swing traders waste hours sifting through thousands of stocks, hunting for setups that already passed their prime. Traditional screeners excel at filtering by price, volume, or financial metrics — but they can't spot a textbook cup-and-handle base or grade the quality of a bull flag consolidation.
Swing trading has evolved dramatically since 2020. Pattern recognition technology now automates what traders once did manually, scanning entire exchanges in seconds and scoring setups by quality. The question isn't whether to use a scanner — it's which type delivers the edge swing traders actually need.
Pattern Recognition vs. Traditional Screening: The Fundamental Divide
Traditional stock screeners rely purely on technical analysis metrics: P/E ratios, moving averages, volume spikes. They answer questions like "Which stocks crossed above their 50-day moving average?" or "Which companies report earnings next week?"
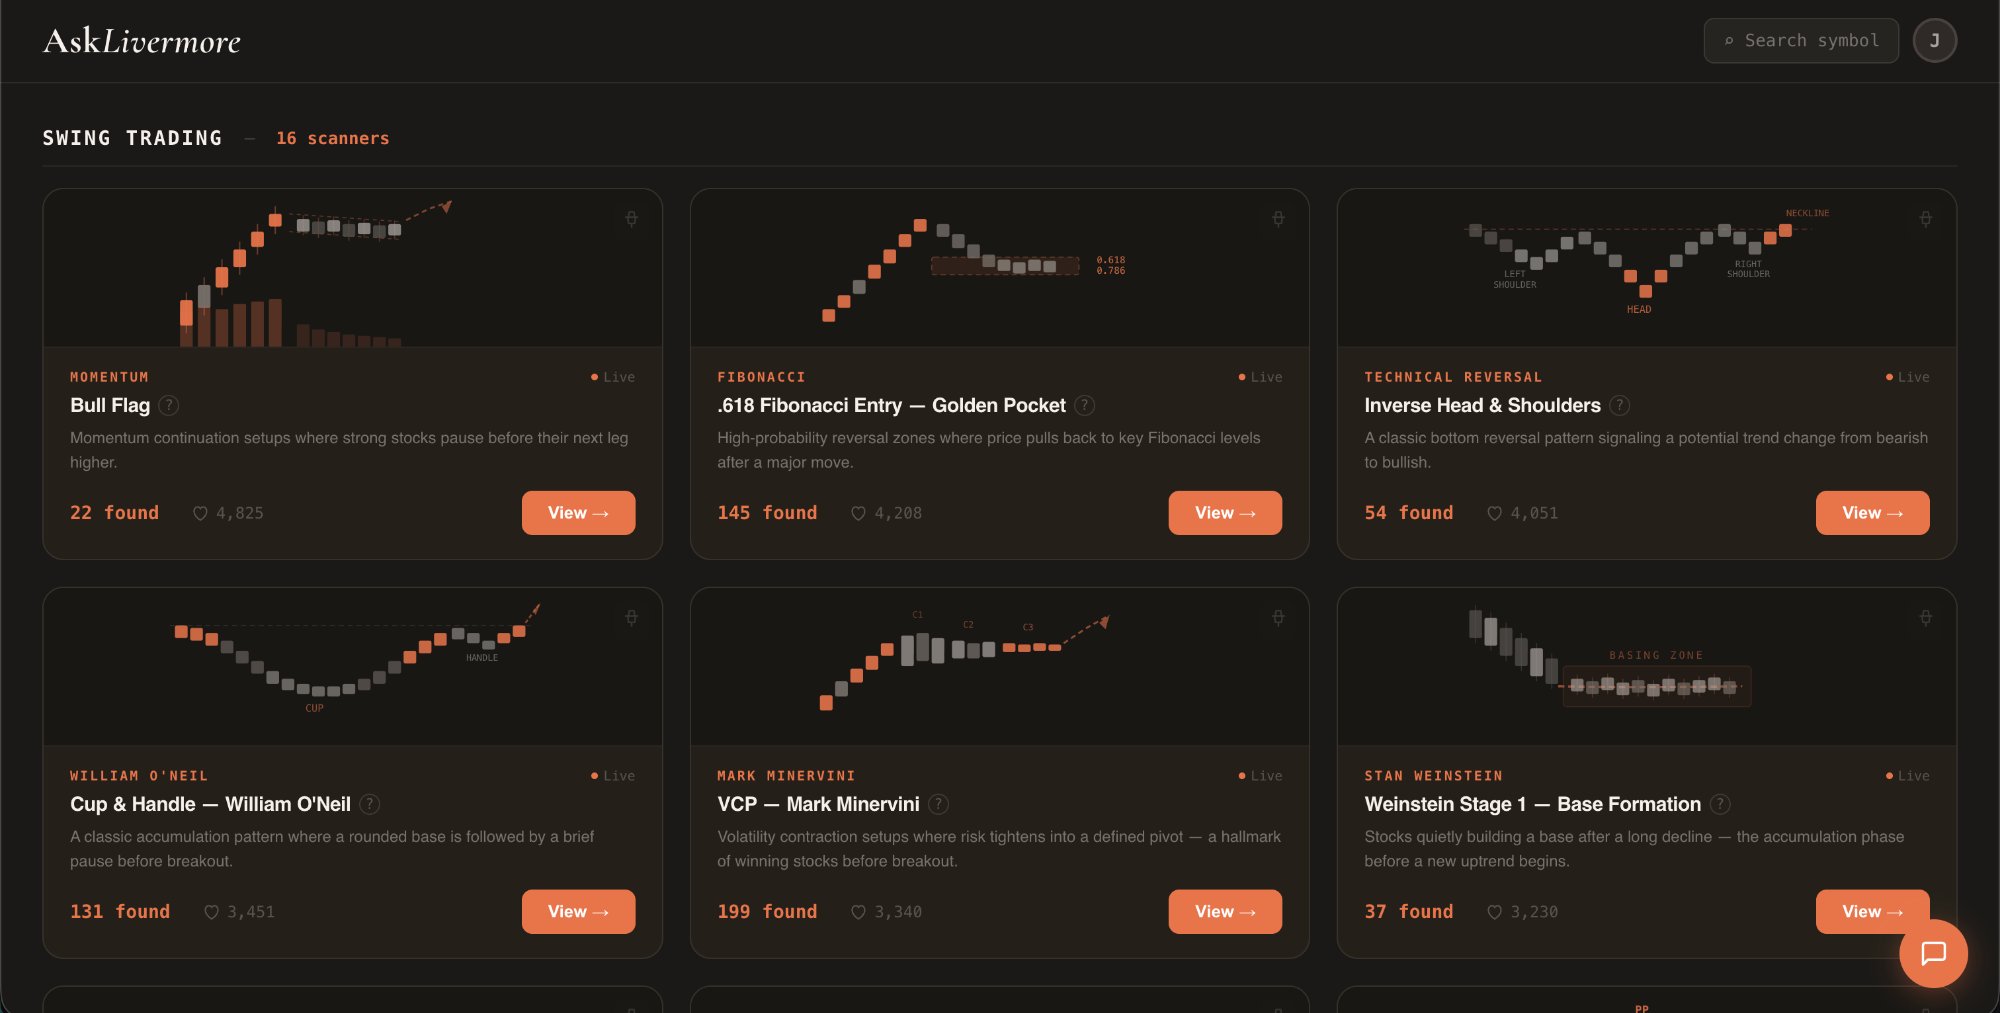
Pattern recognition scanners take a different approach. They identify chart formations that historically lead to profitable moves — cup-and-handle bases, bull flags, VCP contractions. Instead of just filtering data, they interpret price action the way experienced traders do.
This distinction matters for swing traders. While day traders might profit from simple momentum breakouts, swing positions require higher-quality setups with better risk-to-reward ratios. A poorly formed pattern often leads to whipsaws and stopped-out trades.
Pricing: The Scanner in 2026
The cost structure varies dramatically across scanner types. Traditional screeners like FinViz offer basic filtering for free, with premium versions ranging from $25-40 monthly. Professional platforms like Bloomberg Terminal command $2,000+ annually but target institutional users.
Pattern recognition tools occupy the middle ground. Most charge $50-200 monthly, reflecting the complexity of their algorithms. AskLivermore breaks this mold at $29 monthly, with a free tier providing the top 6 results per scanner — enough for most swing traders to evaluate quality before committing.
The pricing gap reflects development costs. Building reliable pattern recognition requires extensive backtesting and machine learning models. Traditional screeners simply query databases.
| Feature | AskLivermore | DeepVue | FinViz | TradingView | |---------|-------------|---------|--------|-------------| | Pattern scanners | 48 across 7 categories | ~12 | Filters only | Manual chart review | | Quality grading | A+ to B scoring | None | None | None | | Real-time scanning | Every 5 min (day trading) | Daily | Delayed 15 min | Manual | | Chart overlays | Auto-drawn patterns | None | None | Manual drawing | | Price | $29/mo ($24/mo annual) | ~$49/mo | $25/mo | $15-60/mo | | Free tier | Top 6 results per scan | No | Basic filters | Basic charts |
Scanner Depth: Quality Over Quantity
Traditional screeners often boast hundreds of filtering options. That breadth sounds impressive until traders realize they're reinventing the wheel, combining multiple filters to approximate what experienced chartists recognize instantly.
AskLivermore takes the opposite approach: 48 specialized scanners across 7 categories. Each scanner targets a specific setup type — bull flags, VCP contractions, earnings gaps, insider buying clusters. The VCP scanner alone incorporates multiple volatility contraction criteria that would require dozens of traditional filters to replicate.
This focused approach eliminates decision paralysis. Instead of wondering which combination of 200+ filters might find cup-and-handle patterns, swing traders simply run the dedicated cup-and-handle scanner.
The Grading Revolution: A+ to B Quality Scoring
Here's where pattern recognition scanners truly differentiate themselves. Traditional screeners present raw results without context. A stock might meet all your filters but represent a poor-quality setup.
Quality scoring changes this dynamic. AskLivermore grades every pattern from A+ to B, considering factors like consolidation depth, volume characteristics, and relative strength. An A+ bull flag might show a 40% pole gain followed by just a 3% pullback on declining volume. A B-grade setup might have similar structure but with concerning volume patterns during consolidation.
This grading system reflects what master traders like Mark Minervini and William O'Neil have taught for decades: not all patterns are created equal. According to Bulkowski's comprehensive pattern studies in "Encyclopedia of Chart Patterns," quality metrics significantly impact success rates. His research across 25 years of S&P 500 data shows that shallow pullbacks in bull flags (under 8% retracement) succeed 74% of the time versus just 58% for deeper pullbacks.
Update Frequency and Market Coverage
Traditional screeners typically update every 15-20 minutes during market hours. That's adequate for end-of-day analysis but insufficient for swing traders who want to catch intraday pattern completions.
Modern pattern recognition tools scan continuously. AskLivermore processes 5,000+ NASDAQ and NYSE stocks in real-time, updating results as patterns develop throughout the trading session. This speed advantage matters when quality setups emerge during earnings reactions or market pivots.
The coverage breadth also differs significantly. Many traditional screeners focus on large-cap stocks or require expensive data feeds for comprehensive small-cap coverage. Pattern recognition platforms typically scan the full universe of liquid stocks, uncovering opportunities in mid-cap names that institutional screeners might miss.
Mobile Experience: Trading on the Go
Most traditional screeners weren't built for mobile-first usage. Their interfaces, designed for desktop analysis with multiple filters and columns, become unwieldy on smartphone screens.
Pattern recognition scanners often provide cleaner mobile experiences. Pre-identified setups with quality grades translate well to smaller screens. Swing traders can review A+ patterns during lunch breaks or commutes, then conduct deeper analysis later.
The workflow difference is substantial. Traditional screeners require recreating complex filter combinations on mobile devices. Pattern scanners present curated results immediately.
Learning Curve: Accessibility vs. Sophistication
Traditional screeners have steep learning curves. New users face hundreds of filtering options without clear guidance on which combinations produce profitable setups. The flexibility that appeals to quantitative traders can overwhelm discretionary swing traders.
Pattern recognition tools reduce this complexity. Traders don't need to understand every technical indicator or filter combination. They need to recognize quality chart patterns — a skill that transfers directly to manual analysis.
However, this simplicity can limit customization. Advanced users might want specific filter combinations that pre-built scanners don't offer. The tradeoff between ease-of-use and flexibility remains real.
Filtering and Sorting: Beyond Pattern Detection
Even pattern recognition scanners need robust filtering capabilities. Swing traders might want to focus on stocks above $20, exclude penny stocks, or prioritize S&P 500 components.
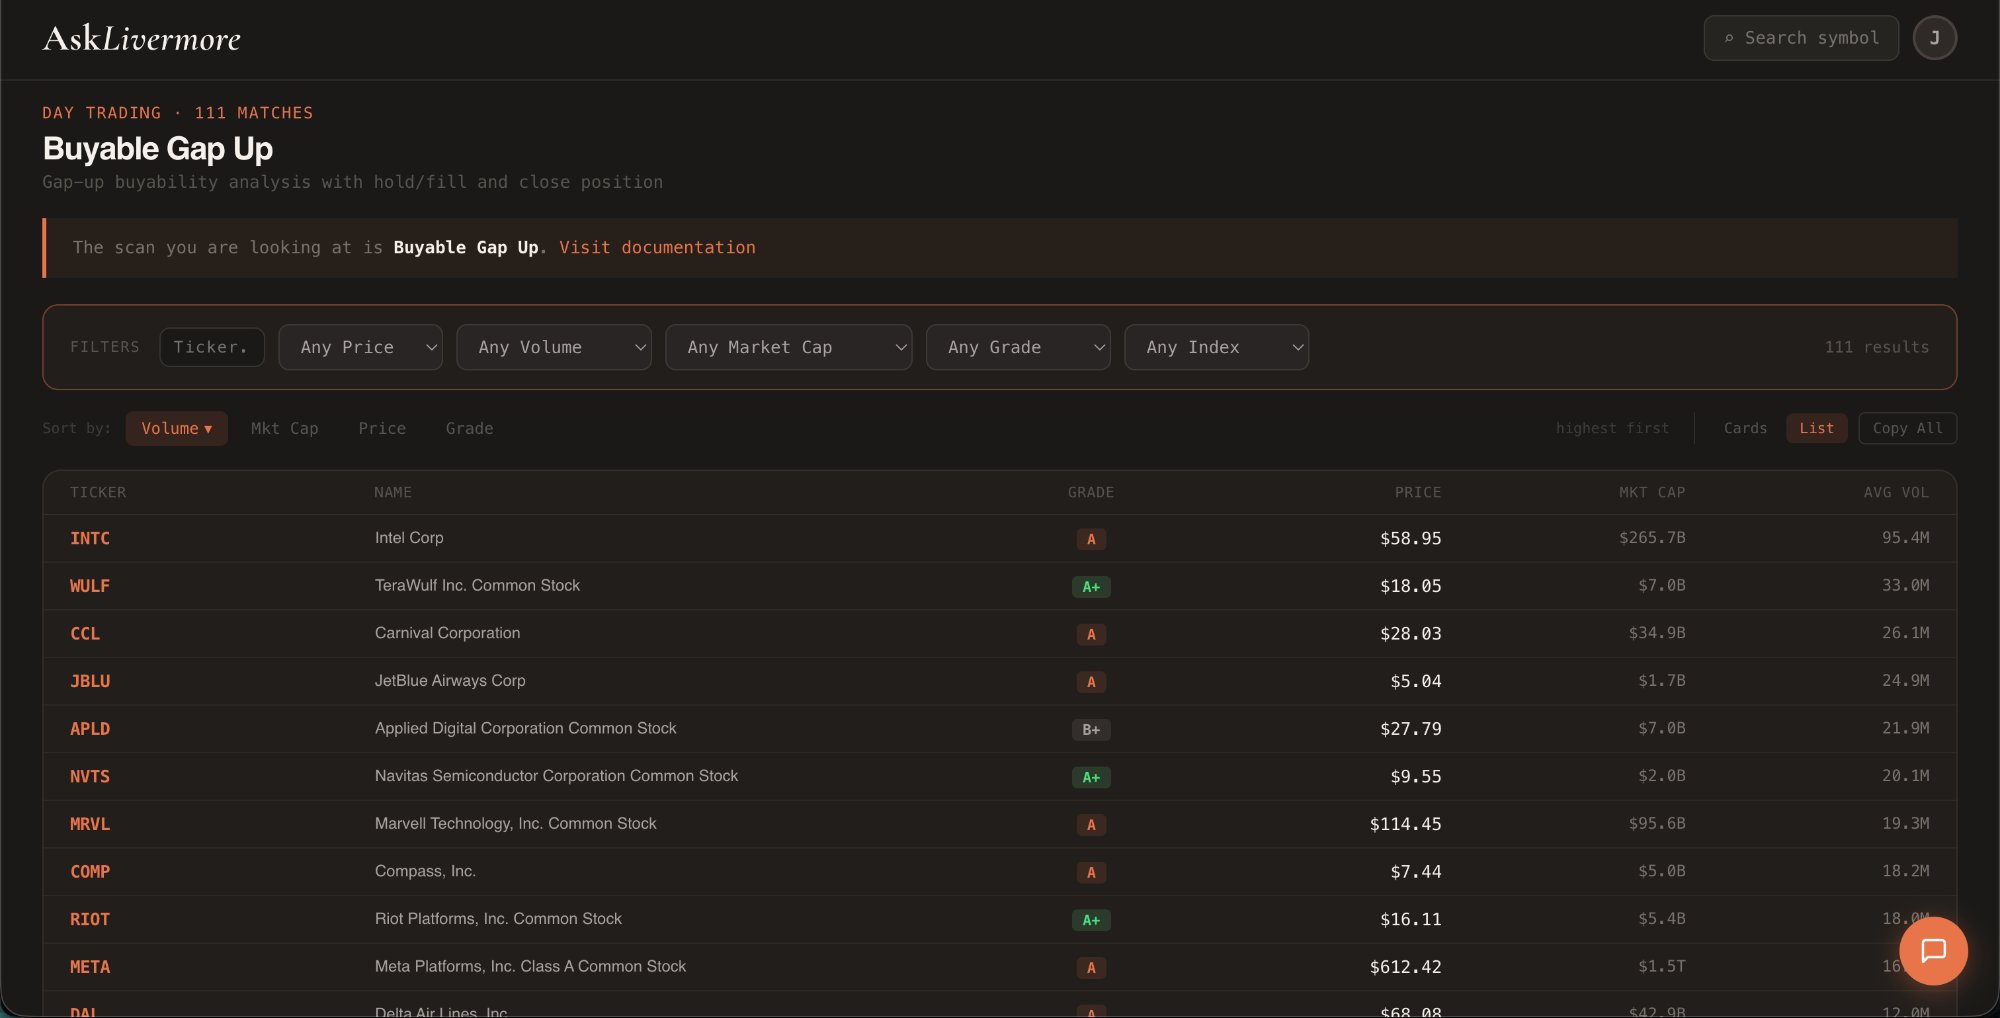
AskLivermore provides essential filters: price range, volume, market cap, quality grade, and index membership (S&P 500, Nasdaq-100, Dow 30). These cover most swing trading requirements without overwhelming the interface.
Traditional screeners offer more granular filtering but often bury essential functions in complex menus. The best approach balances comprehensive options with intuitive navigation.
Integration with Chart Analysis
Pattern recognition without immediate chart access creates workflow friction. Traders identify interesting setups, then must manually input symbols into separate charting platforms.
Integrated solutions eliminate this step. AskLivermore provides live charts with 50-day moving averages and previous close overlays directly within scan results. Traders can evaluate patterns and context without switching platforms.
Traditional screeners typically link to basic charts or require third-party integrations. The disconnected workflow slows analysis and increases the chance of missing time-sensitive opportunities.
Real-Time Market Movers: Pre and Post-Market Edge
Swing traders gain significant advantages by monitoring pre-market and after-hours activity. Earnings reactions, news events, and institutional positioning often create the best setups before regular trading begins.
Specialized scanners track these opportunities systematically. AskLivermore's pre-market movers and post-market scanners identify significant gap situations as they develop.
Traditional screeners rarely emphasize extended-hours activity. Their end-of-day focus misses the early positioning opportunities that create swing trading profits.
Who Benefits Most: Matching Tools to Trading Styles
Different scanner types serve different trader profiles. Traditional screeners excel for:
- Quantitative traders who prefer building custom filter combinations
- Long-term investors focusing on fundamental metrics
- Options traders needing specific Greeks or volatility data
- Institutional users requiring extensive customization
Pattern recognition scanners better serve:
- Discretionary swing traders who trade chart patterns
- Part-time traders wanting pre-filtered, quality setups
- Newer traders learning to recognize profitable formations
- Busy professionals who need efficient setup identification
The distinction isn't absolute. Some successful traders combine both approaches, using traditional screeners for broad market analysis and pattern scanners for specific setup identification.
The Community Factor: Learning from Other Traders
Traditional screening platforms often have large, established communities. Forums, educational content, and shared filter combinations provide valuable learning resources.
Pattern recognition tools typically have smaller but more focused communities. The conversations center on pattern quality, setup timing, and risk management rather than filter optimization.
For swing traders, the focused community discussions often prove more valuable than broad-based screening forums. Pattern-specific insights translate directly to trading decisions.
For traders weighing platforms head-to-head, our AskLivermore vs DeepVue comparison and the best DeepVue alternatives roundup cover the full landscape.
Looking Forward: The Scanner Evolution
The line between traditional screening and pattern recognition continues blurring. Some traditional platforms add basic pattern detection features. Pattern recognition tools incorporate more fundamental filters.
However, the core philosophical difference remains. Traditional screeners start with data and let users build queries. Pattern recognition tools start with proven chart formations and automate the identification process.
For swing traders in 2026, this distinction drives tool selection. Those who prefer building custom analytical frameworks gravitate toward traditional screeners. Traders who want to focus on execution rather than setup identification choose pattern recognition platforms.
Making the Choice: Practical Considerations
The best stock scanner for swing traders depends on individual priorities. Budget-conscious traders might start with free traditional screeners, accepting the additional manual work required to identify quality patterns.
Traders who value time efficiency and pattern quality often prefer dedicated pattern recognition tools. The higher cost per month typically pays for itself through improved setup selection and reduced analysis time.
Consider also the learning investment. Traditional screeners require understanding multiple technical indicators and their optimal combinations. Pattern recognition tools require understanding chart patterns and their quality characteristics.
Both skills benefit swing traders, but the pattern recognition approach aligns more closely with how successful discretionary traders actually think about markets.
The Verdict: Efficiency Meets Quality
The swing trading scanner has matured significantly. Traditional screeners remain powerful for traders who want maximum customization and don't mind complex workflows.
For most swing traders, though, pattern recognition tools like AskLivermore offer superior efficiency. The combination of comprehensive pattern detection, quality grading, and reasonable pricing creates compelling value.
The key insight: successful swing trading depends more on pattern quality than pattern quantity. A single A+ rated setup often provides better risk-adjusted returns than dozens of unfiltered possibilities.
Traditional screeners excel at broad market filtering but require significant expertise to identify quality patterns. Pattern recognition scanners automate this crucial step, though they sacrifice some customization flexibility. For swing traders focused on chart-based setups, the pattern recognition approach typically delivers better results with less time investment.
Ready to experience the difference? Explore AskLivermore's 48 pattern scanners and see how quality-focused scanning can transform your swing trading approach. The free tier provides enough access to evaluate whether pattern recognition scanning fits your trading style.
AskLivermore scans 5,000+ stocks daily and scores every setup from A+ to B.
View VCP results →